

By Isaac Peck, Publisher
You’ve probably seen the headlines! Insurance agency valuations have been hitting record highs, driven in part by the private equity’s enormous interest in the space as well as the low interest rate environment created during the COVID-19 pandemic.
Of course, interest rates have risen substantially since then. The Federal Reserve (Fed) spiked interest rates dramatically in late 2022 and early 2023, increasing the Federal Funds Effective Rate roughly 5 percent in a 12-month period.
Even though the Fed has issued two rate cuts in 2024, the Effective Rate is still 4.5 percent to 4.75 percent, compared to 0 percent in early 2022. Interest rates are obviously a key driver of borrowing costs and such a sharp increase was widely expected to have a substantial negative impact on insurance agency valuations. So far that has not happened.
According to Marsh Berry, a leading provider of investment banking, mergers and acquisitions, and consulting services in the insurance sector, valuations have continued to rise in 2022, 2023, and 2024.
While the actual number of transactions have declined year-over-year, valuations have remained high and have actually continued to increase.
Here’s what you need to know about insurance agency valuations today.
Valuations That Defy Logic
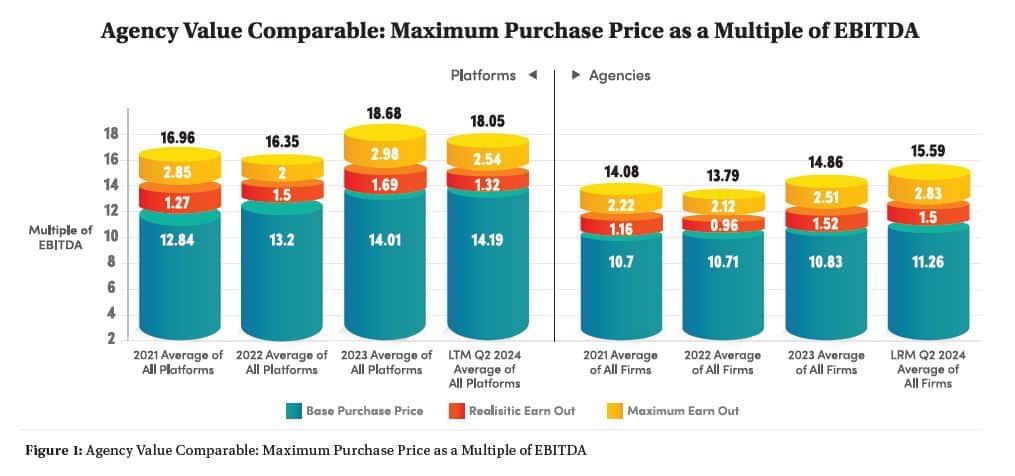
The numbers that Marsh Berry publishes every year are shocking. They show a valuation multiple of EBITDA of 11.26 times earnings, with an additional “Earn-Out” of 4.33 times earnings. (EBITDA stands for Earnings Before Interest, Taxes, Depreciation, and Amortization. An “Earn- Out” is a contingent payment that the seller only receives from the buyer when specific performance targets are met.)
Here’s what those numbers mean. As an example, if you had an insurance agency with EBITDA of $3 million per year, applying these averages to your valuation would mean that your agency would be worth 11.26 x $3,000,000 = $33,780,000. Plus, you’d be eligible for an additional earn-out of $12,990,000 (4.33 x $3,000,000). For a total potential valuation of $46,770,000— on a business making $3 million per year! Not bad right?
These are astronomical numbers. (To be fair, Marsh Berry posits the realistic earnout number to be 1.5 times earnings, not the “aspirational” 4.33 number.)
But even still, these valuations are incredibly rich, and Marsh Berry’s data continues to show a very slight increase year-over- year from 2021, to 2022, to 2023, to 2024. See Figure 1 for “Average” insurance agency EBITDA multiples that include the earn-out ranges.
Marsh Berry also reports valuations of “Platforms,” which it defines somewhat vaguely as involving a high-level transaction for a buyer, typically due to “new geography niche, expertise, size, or talent,” as being even higher. (“Platforms” in more generic private equity (PE) terms refers to a company that a PE firm acquires as a foundation to build upon through further acquisitions, as opposed to a “bolt-on” acquisition.) More specifically, Platforms enjoy up to three times higher valuation multiple than the EBITDA multiple valuation of the “average” insurance agency in Marsh Berry’s data. See Figure 1: Agency Value Comparable: Maximum Purchase Price as a Multiple of EBITDA for Platform valuations over the last three years.
Private Equity Driving
Private equity has been driving much of the acquisition activity in the insurance space—especially at the higher end of the market. But the largest insurance brokerages have also been playing a role. Roughly half of the transactions completed are reported to be made by just 10 large firms. Many estimate that over the last 10 years, the capital invested by private equity into the insurance agency space has been in the tens of billions. Additionally, in an article titled “Focused Insights: Is Your Firm Ready For a ‘What If ’ Scenario?,” Marsh Berry writes that in the past 12 months (ending June 2024), there has been over “$87 billion in institutional debt raised in this industry, representing the highest amount ever raised in the insurance industry in a 12-month period.”
The Catch: Alternate Universe
Here’s the catch on these valuations as reported by Marsh Berry—and why they are essentially an “alternate universe” for most insurance agency owners.
What kind of insurance agencies are Marsh Berry benchmarking here anyways?
Marsh Berry is an investment banking and consulting firm that specializes in working with larger insurance agencies. Citing the source of their data, Marsh Berry reports that it comes from their “proprietary database” and is “compiled from transactions in which we were directly involved, those from which we have detailed information, and transactions in the public record.”
Here’s what’s to note about that. First of all, transactions in the public record are almost always going to be for very large, in some cases publicly traded, insurance agencies. Think Aon’s acquisition of middle market insurance broker NFP for $13.4 billion (at a valuation of 15 times EBITDA).
As far as Marsh Berry’s own data, here’s a very important fact to keep in mind: Marsh Berry does not represent firms with less than $1 million in annual revenue and their sweet spot is advising and representing firms with annual revenues north of $3 to $5 million in revenue. In other words, their expertise, and the background behind their own internal deals (and data), is working with the largest insurance agencies in the United States. These agencies are the white whales of the insurance profession.
To put it in perspective, according to Big I’s 2022 Agency Universe Study, roughly 84% of all insurance agencies in the United States have annual revenue of less than $1.25 million. (Revenue is defined by commission, fees, and other income.)
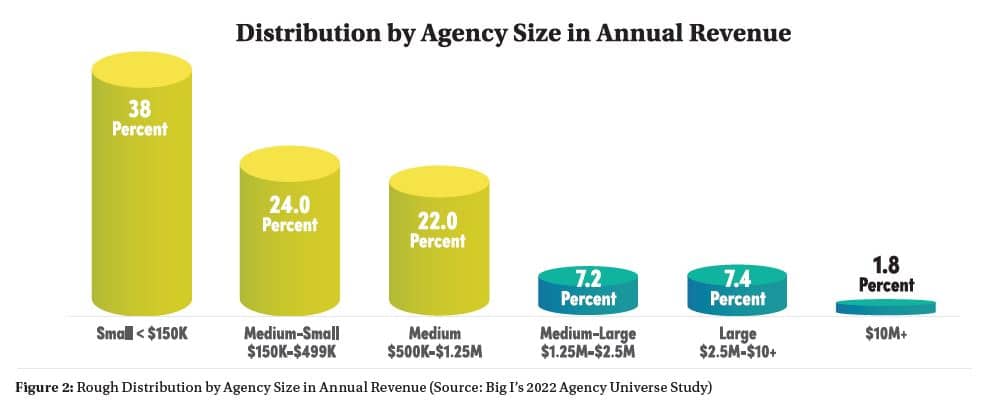
Just over 7 percent of insurance agencies have revenues between $1.25 million and $2.5M and then less than 10% of insurance agencies have revenue over $2.5M.
Less than 2 percent of insurance agencies have revenue of $10 million or more.
Based on this information, the valuations that are being proffered by Marsh Berry, likely only apply to between 5 to 8 percent of insurance agencies in the United States, perhaps less.
Valuations for Smaller Agencies
The reality for smaller insurance agencies is nothing like the numbers published by Marsh Berry. One need only look at actual listings of smaller insurance agencies for sale to get a good handle on where valuations are for agencies with revenue of less than $1 million in revenue.
SpringTree Group is a Texas based insurance agency merger and acquisitions broker that specializes in small-to-mid-size insurance agencies. Agency owners that are interested in buying or selling can easily sign up for SpringTree Group’s newsletter and see what is on the market. SpringTree usually has 25-40 insurance agencies listed at any given time, the majority of which are property and casualty agencies or books of business.
AgencyEquity.com is another resource that lists a number of insurance agencies and books of business for sale. Usually over 70 agency listings are advertised on AgencyEquity.com.
Based on listings offered on SpringTree and AgencyEquity.com, smaller agency books of business are trading based on multiples of revenue, not EBITDA. The average small insurance agency (or book of business) is selling for anywhere between 1X to 3X its annual revenue, with an average listing and sale price in the 1.5X to 2.5X annual revenue range.
Once agency revenue exceeds $500,000 and moves up towards the $1.25 million mark, valuations increase slightly. As an agency’s revenue exceeds $500,000, and especially as it approaches $1 million, the agency might start to enjoy a valuation based on EBITDA, instead of just a strict revenue multiple. These EBITDA multiples can move into the 4X to 8X range (with the multiple increasing in correlation to EBITDA), but still remain a far cry from the multiples indicated by Marsh Berry for $5+ million annual revenue agencies.
The very, very wide variance in insurance agency valuations, especially as it relates to the size of agency can sometimes lead to misunderstandings amongst agency owners—with ambitious agency owners self-listing their $500,000 revenue agency for $5,000,000 and hoping for a Hail Mary!
Other Factors
Of course, revenue (for smaller agencies) and EBITDA (for larger agencies) are not the only driving factors of an insurance agency’s valuation. Other factors such as growth rate, type of business (personal versus commercial), size of accounts, staff, systems in place, niche or focus, and geography can all play a significant factor in the value a buyer may perceive in an agency or book of business. These factors come into play for both small and large agencies.
Conclusion
So while we can conclusively say that valuations for the top 5 percent of insurance agencies have skyrocketed, has much changed for the average insurance agency owner and the small insurance agency?
Overall, it is safe to observe that valuations have increased modestly for small agency owners. While 1X to 2X annual revenue was a typical valuation for a small insurance agency 10 years ago, today a more “normal” valuation is in the 1.5X to 2.5X range.
Along similar lines, the small-but-bigger agencies with revenues of $500,000 to $1,000,000 in annual revenue, and the more medium size agencies with revenues of $1M to $2.5M also have seen a modest increase in their valuations compared to 10 years ago. With the multiple increasing a few points as the size (and profitability) of the insurance agency gets larger and larger.
But, of course, the largest change in insurance agency valuations is reserved for those larger revenue agencies—the top 5 percent and beyond.
To your success!